
Bias in Movie Ratings
Watching movies is one of the most popular pasttimes today. There are so many movies being released for streaming every year, and it is impossible to keep up with all of them. When someone is looking for a new movie to watch, he/she will often turn to movie-related sites, like IMDB or rotten tomatoes, which aggregate ratings, reviews, and other information about movies. One of the most important factors influencing one's decision to watch a movie is the overall rating. However, does the rating reasonably represent the entire population's opinion of the movie?
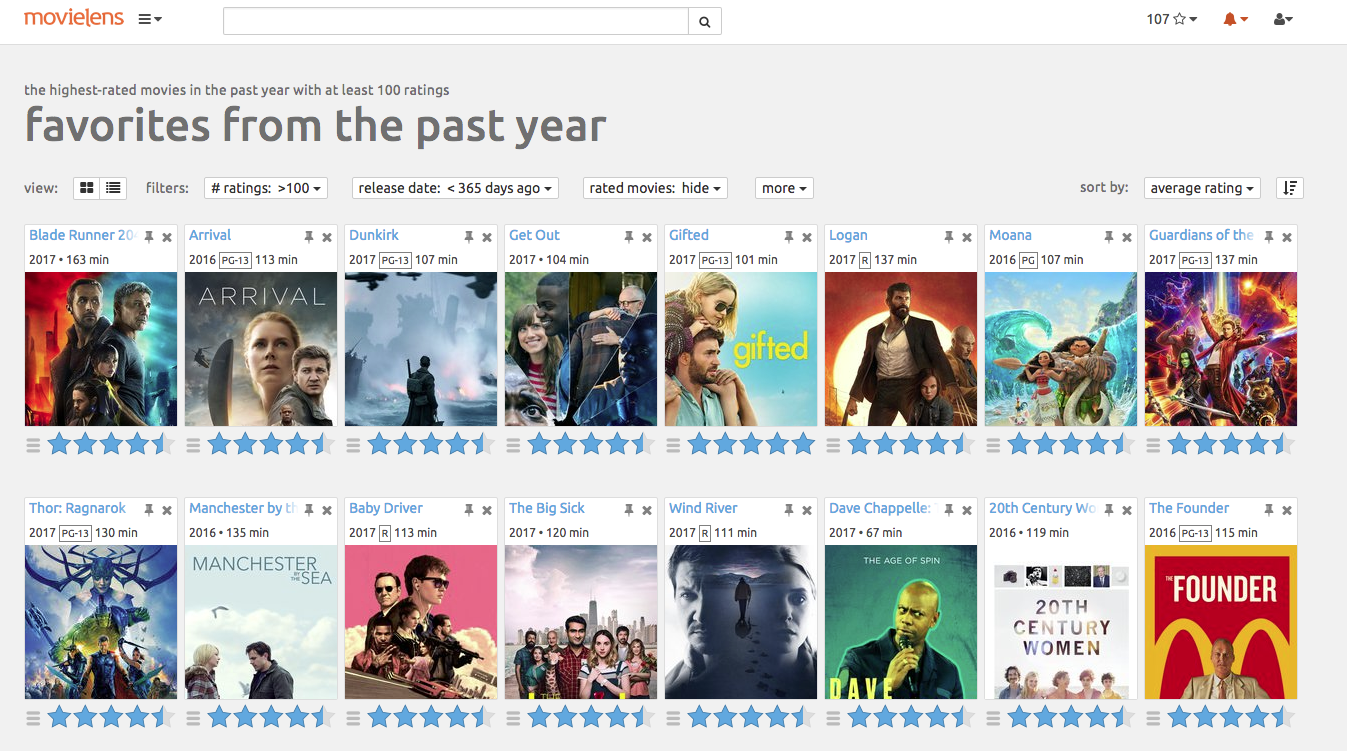
To address this question, I will use the enormous MovieLens data sets (http://movielens.org), which is collected by GroupLens Research (https://grouplens.org/datasets/movielens/). This dataset consists of more than 26 million ratings of approximately 45,000 movies, with around 270,000 users.
Take a look at the distribution of movie release years by genre
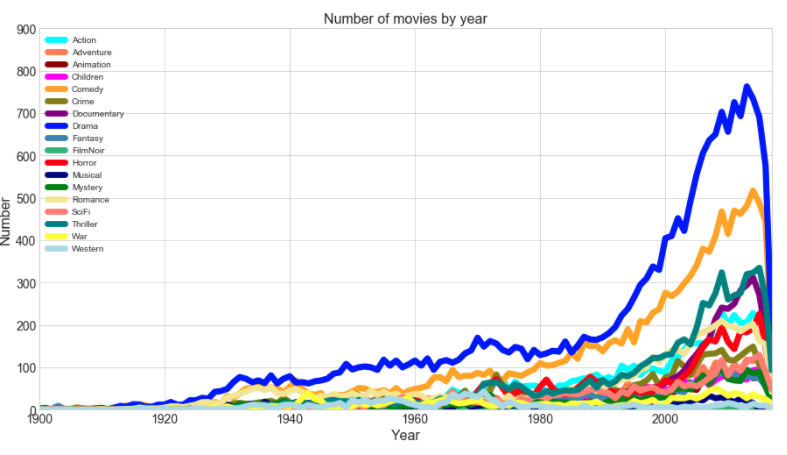
Drama and Comedy films clearly vastly outnumber all the other genres! The plot above only demonstrates the relative popularity of different genres over time.
Next, examine the relative popularity of each genre overall
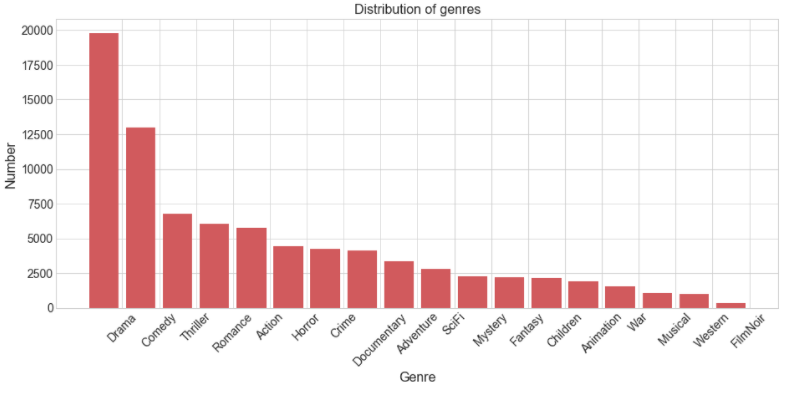
The above bar-plot shows the total number of movies for each genre. Drama and Comedy are the most dominant genres, which means that many people like watching movies of these genres, and so it is likely that producers try to make these types of films more frequently. Note that the total number of movies in the figure above is greater than the previous movie distribution plot because movies are counted multiple times if they have multiple genres.
The above table shows the combined datasets when I merge the movie table with the users and their ratings. Now, it is possible to track users behavior in their ratings. So, one way I could explore potential bias in a user's ratings is to assess whether a fan of a certain genre will rate movies of that genre higher/lower than the general public. First we need to define what is a fan of a genre.
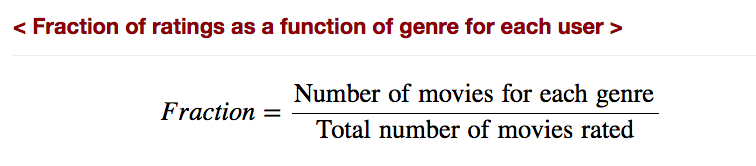
How can we define a group of fans for each genre?
Selecting the fans for each genre is a tough mission. In this project, I define fans for each genre as people who reviewed the specific genre more frequently compared to movies of other genres. For example, considering a person (person A) reviewed 1,000 movies in the dataset, and person A reviewed 300 SciFi movies out of the 1,000 they reviewed. I would consider person A to be a fan of SciFi (For the average person, SciFi movies only account for 6% of the movies they rated). I will explain in detail in the charts below.
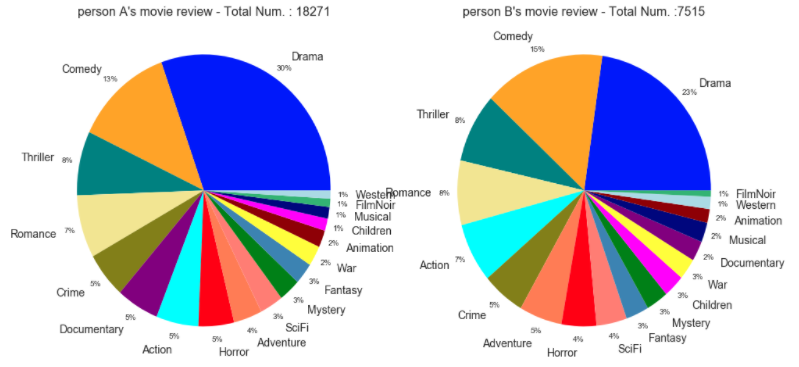
The pie chart above is an example of two people's genre distributions for all the movies they rated. The reason why Drama and Comedy are more dominant than other genres is because there are many movies in these genres. The high fraction for drama and comedy does not neccesarily mean that they are fans of Drama or Comedy, but might simply reflect the fact that these genres are so prevalent. The charts above are pretty typical of an average users voting habits in the MovieLens database.
Now, let's look at a few outliers. The chart below shows the rating distributions for people who appear to be fans of Horror movies.
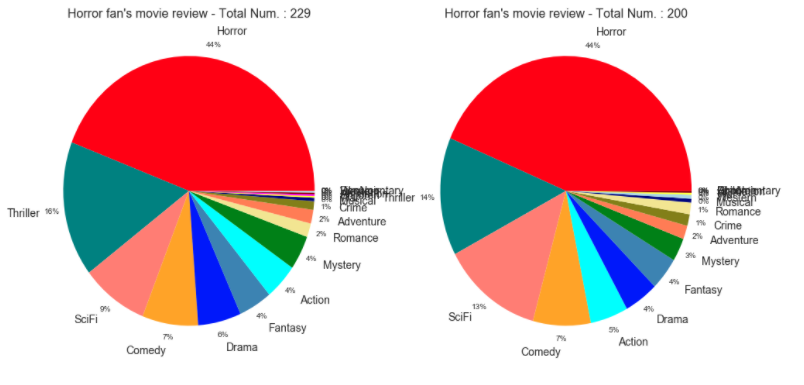
Note that the UNUSUAL Horror fans rated far fewer movies than typical users in my samples. As seen in the chart above, the distribution is very different from the previous plots. In the case of these people, I will consider them to be fans of horror movies.
I selected fans of each genre following the steps below:
- Start by looking at the relative fraction of ratings by genre for the overall population. Then, it stands to reason that someone who is a fan of a certain genre, and who watches a disproportionately large fraction of movies in that genre, would rate movies in that genre more frequently than the average person does.
- Look for outliers who rated movies of that genre at a much higher frequency than the overall population.
The box-plot below shows the typical range of percentages of certain genres that users reviewed.
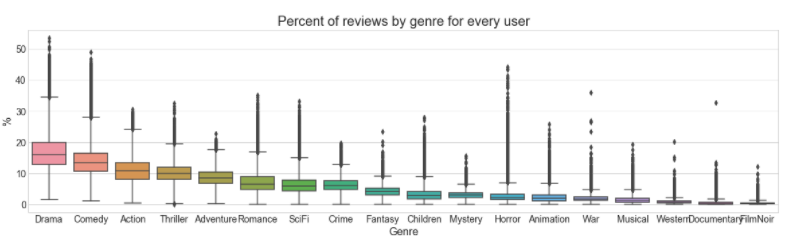
The colored boxes in the box-plot above highlight the 25%-75% range of the distribution for each genre that people reviewed. The upper whiskers corresponds to the top 1% of the distribution. Based on this information, I consider a fan to be a person who is identified as an outlier above the upper whiskers for each genre. For example, if someone has rated drama movies at more than 35%, I would define this person as a fan of drama (Look at the box graph for drama). Therefore, I chose 500 people (1% of total sample of 50,000) for each genre as the group of fans for that genre.
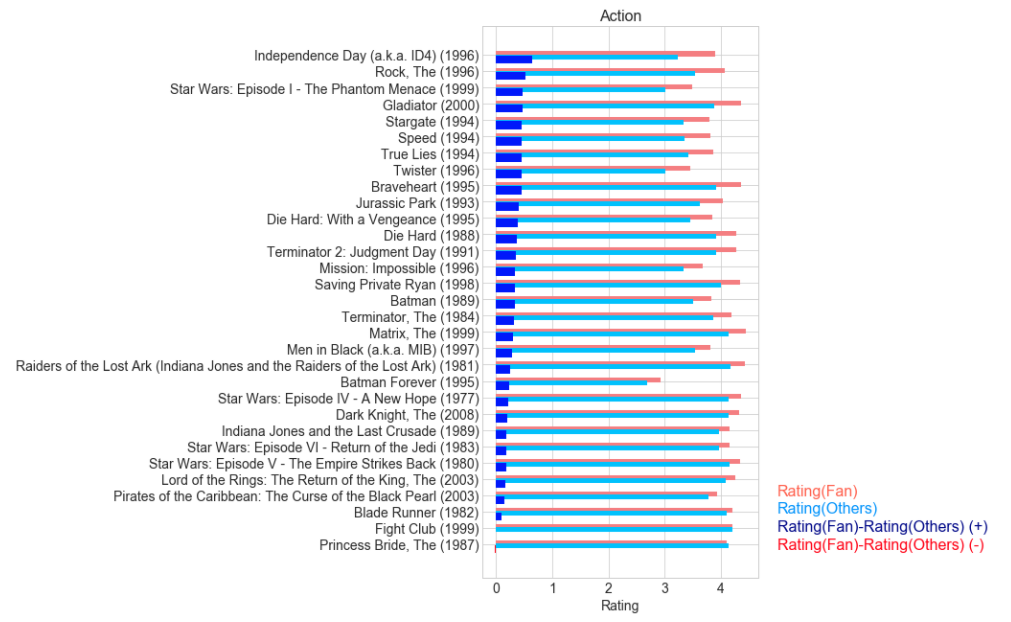
The figure listes Top 30 Action movies, ordered by the difference between fans' average ratings and non-fans' average ratings. The figure shows that most of TOP 30 movies has higher ratings from the fans of the genre. However, there are some exceptions, which are not popular from the fans.
However, many movies overlap between different genres and it is not always that easy to separate very similar genres from each other. Therefore, the best approach to analyze movie preferences might not be to try to separate each genre from each other genre, but to allow for correlations between genres to be included in the analysis. In the following section, I will explore an alternate technique using Principal Component Analysis (PCA) and K-means clustering.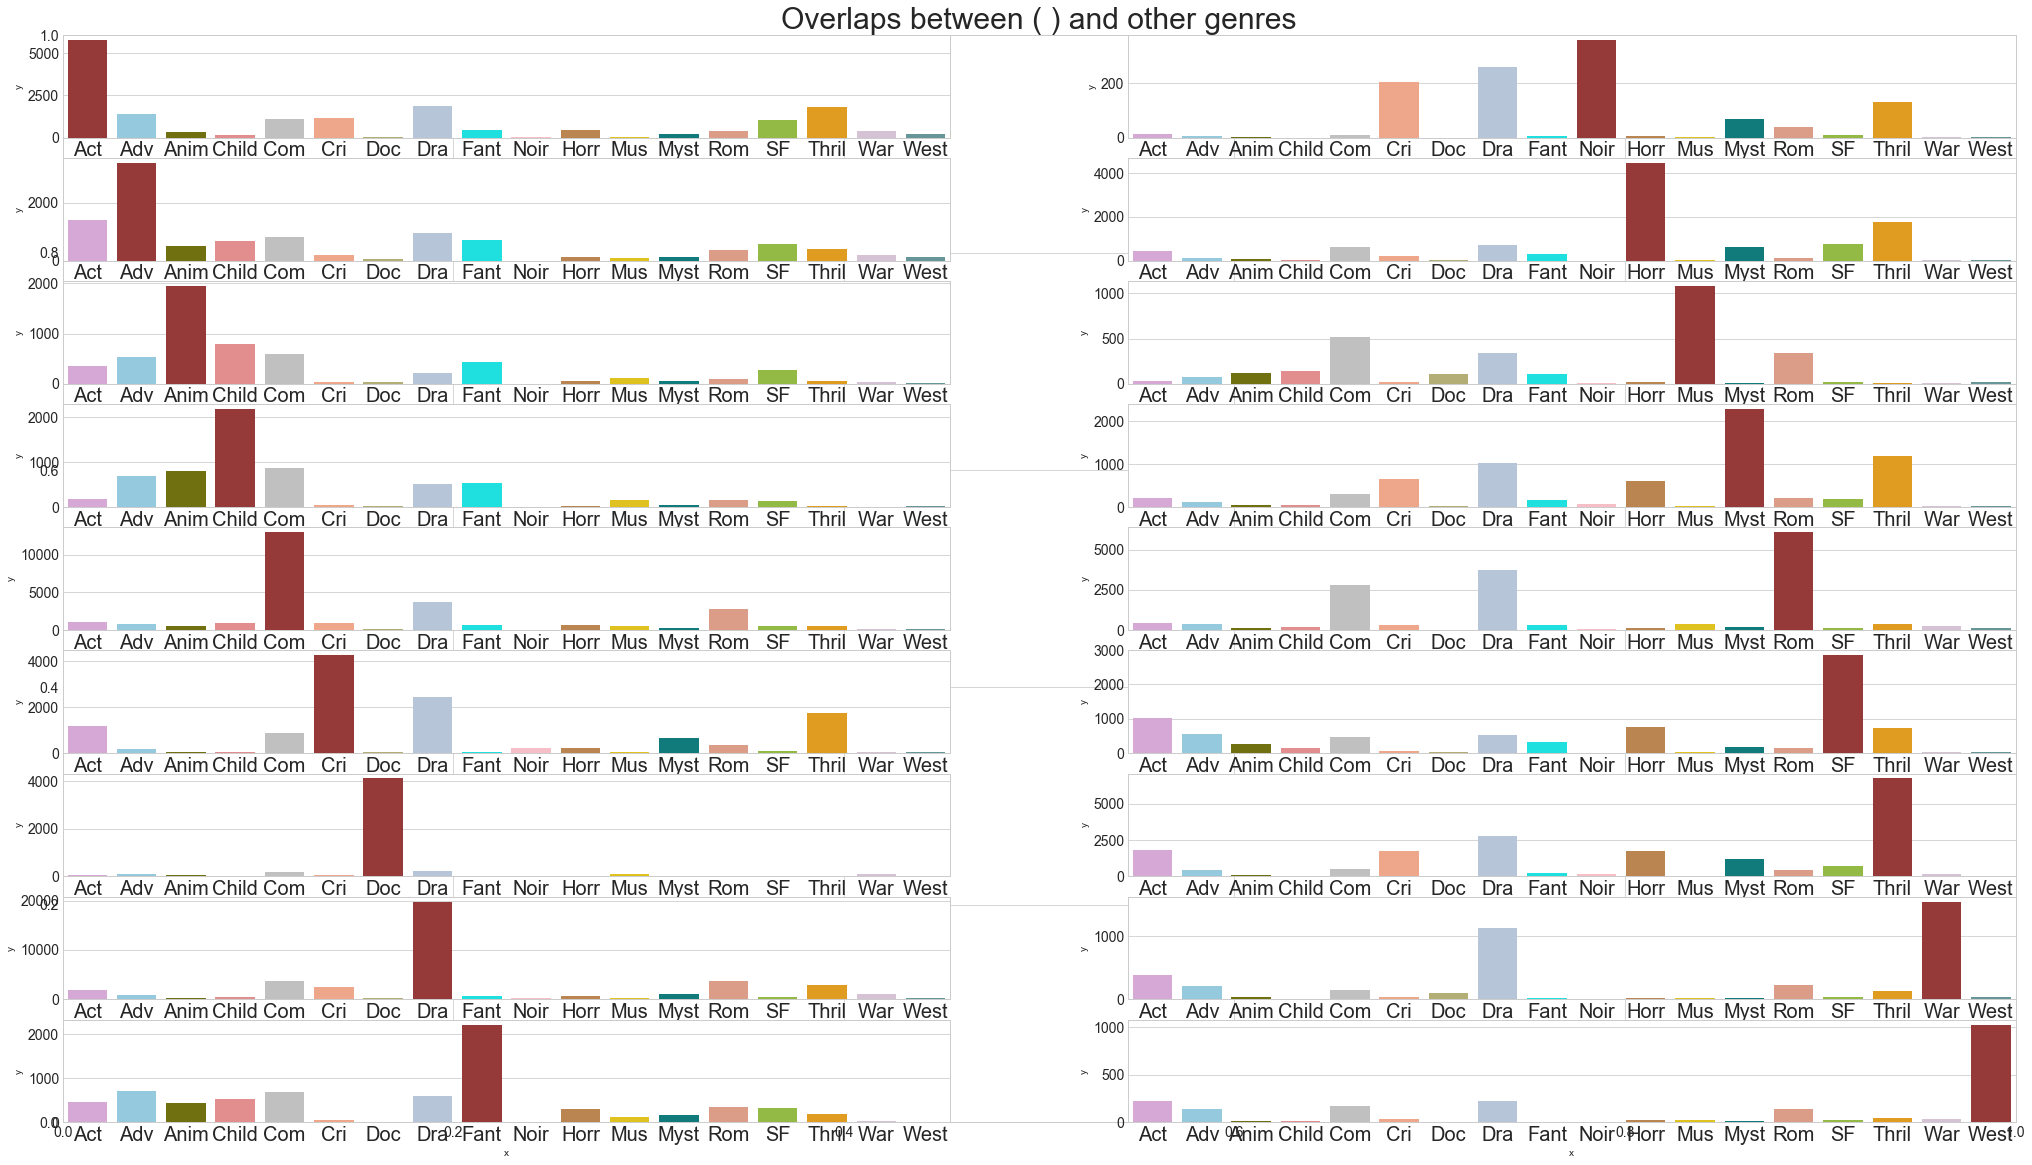
Let's examine any correlations between the ratings of different genres
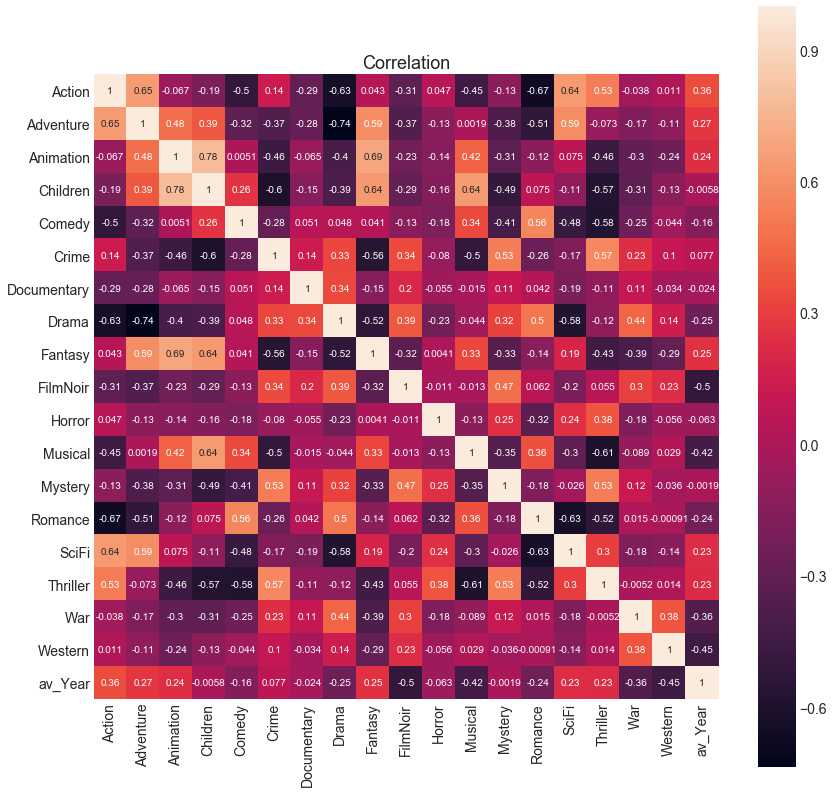
The correlation matrix heatmap above reveals some fundamental characteristics of movies and user preferences that are worth explaining, namely:
Strong correlations exist between:- Action & Adventure
- Action & SciFi
- Animation & Children
- Animation & Fantasy
- Adventure & Fantasy
- Children & Fantasy
- Action & Drama
- Action & Romance
- Adventure & Drama
- Children & Crime
- Musical & Thriller
Let's examine the genre preferences in a more quantitative statistical way, using Principal Component Analysis (PCA)
I take the matrix of users (rows) and number of reviews by genre (columns) and perform a decomposition of that matrix into the sum of eigenvectors times corresponding eigenvalues. This has the effect of re-casting the matrix into a set of orthogonal axes, and when I sort those eigenmodes from the largest (absolute value) eigenvalue to smallest, the first couple of eigenmodes each correspond to the axes along which we find the greatest variance in our data. The result, plotted blow for the top two eigenmodes, shows how each of them naturally corresponds to some of the most fundamental divides between user preferences in genres (where we see weights of some genres having similar or opposing signs)
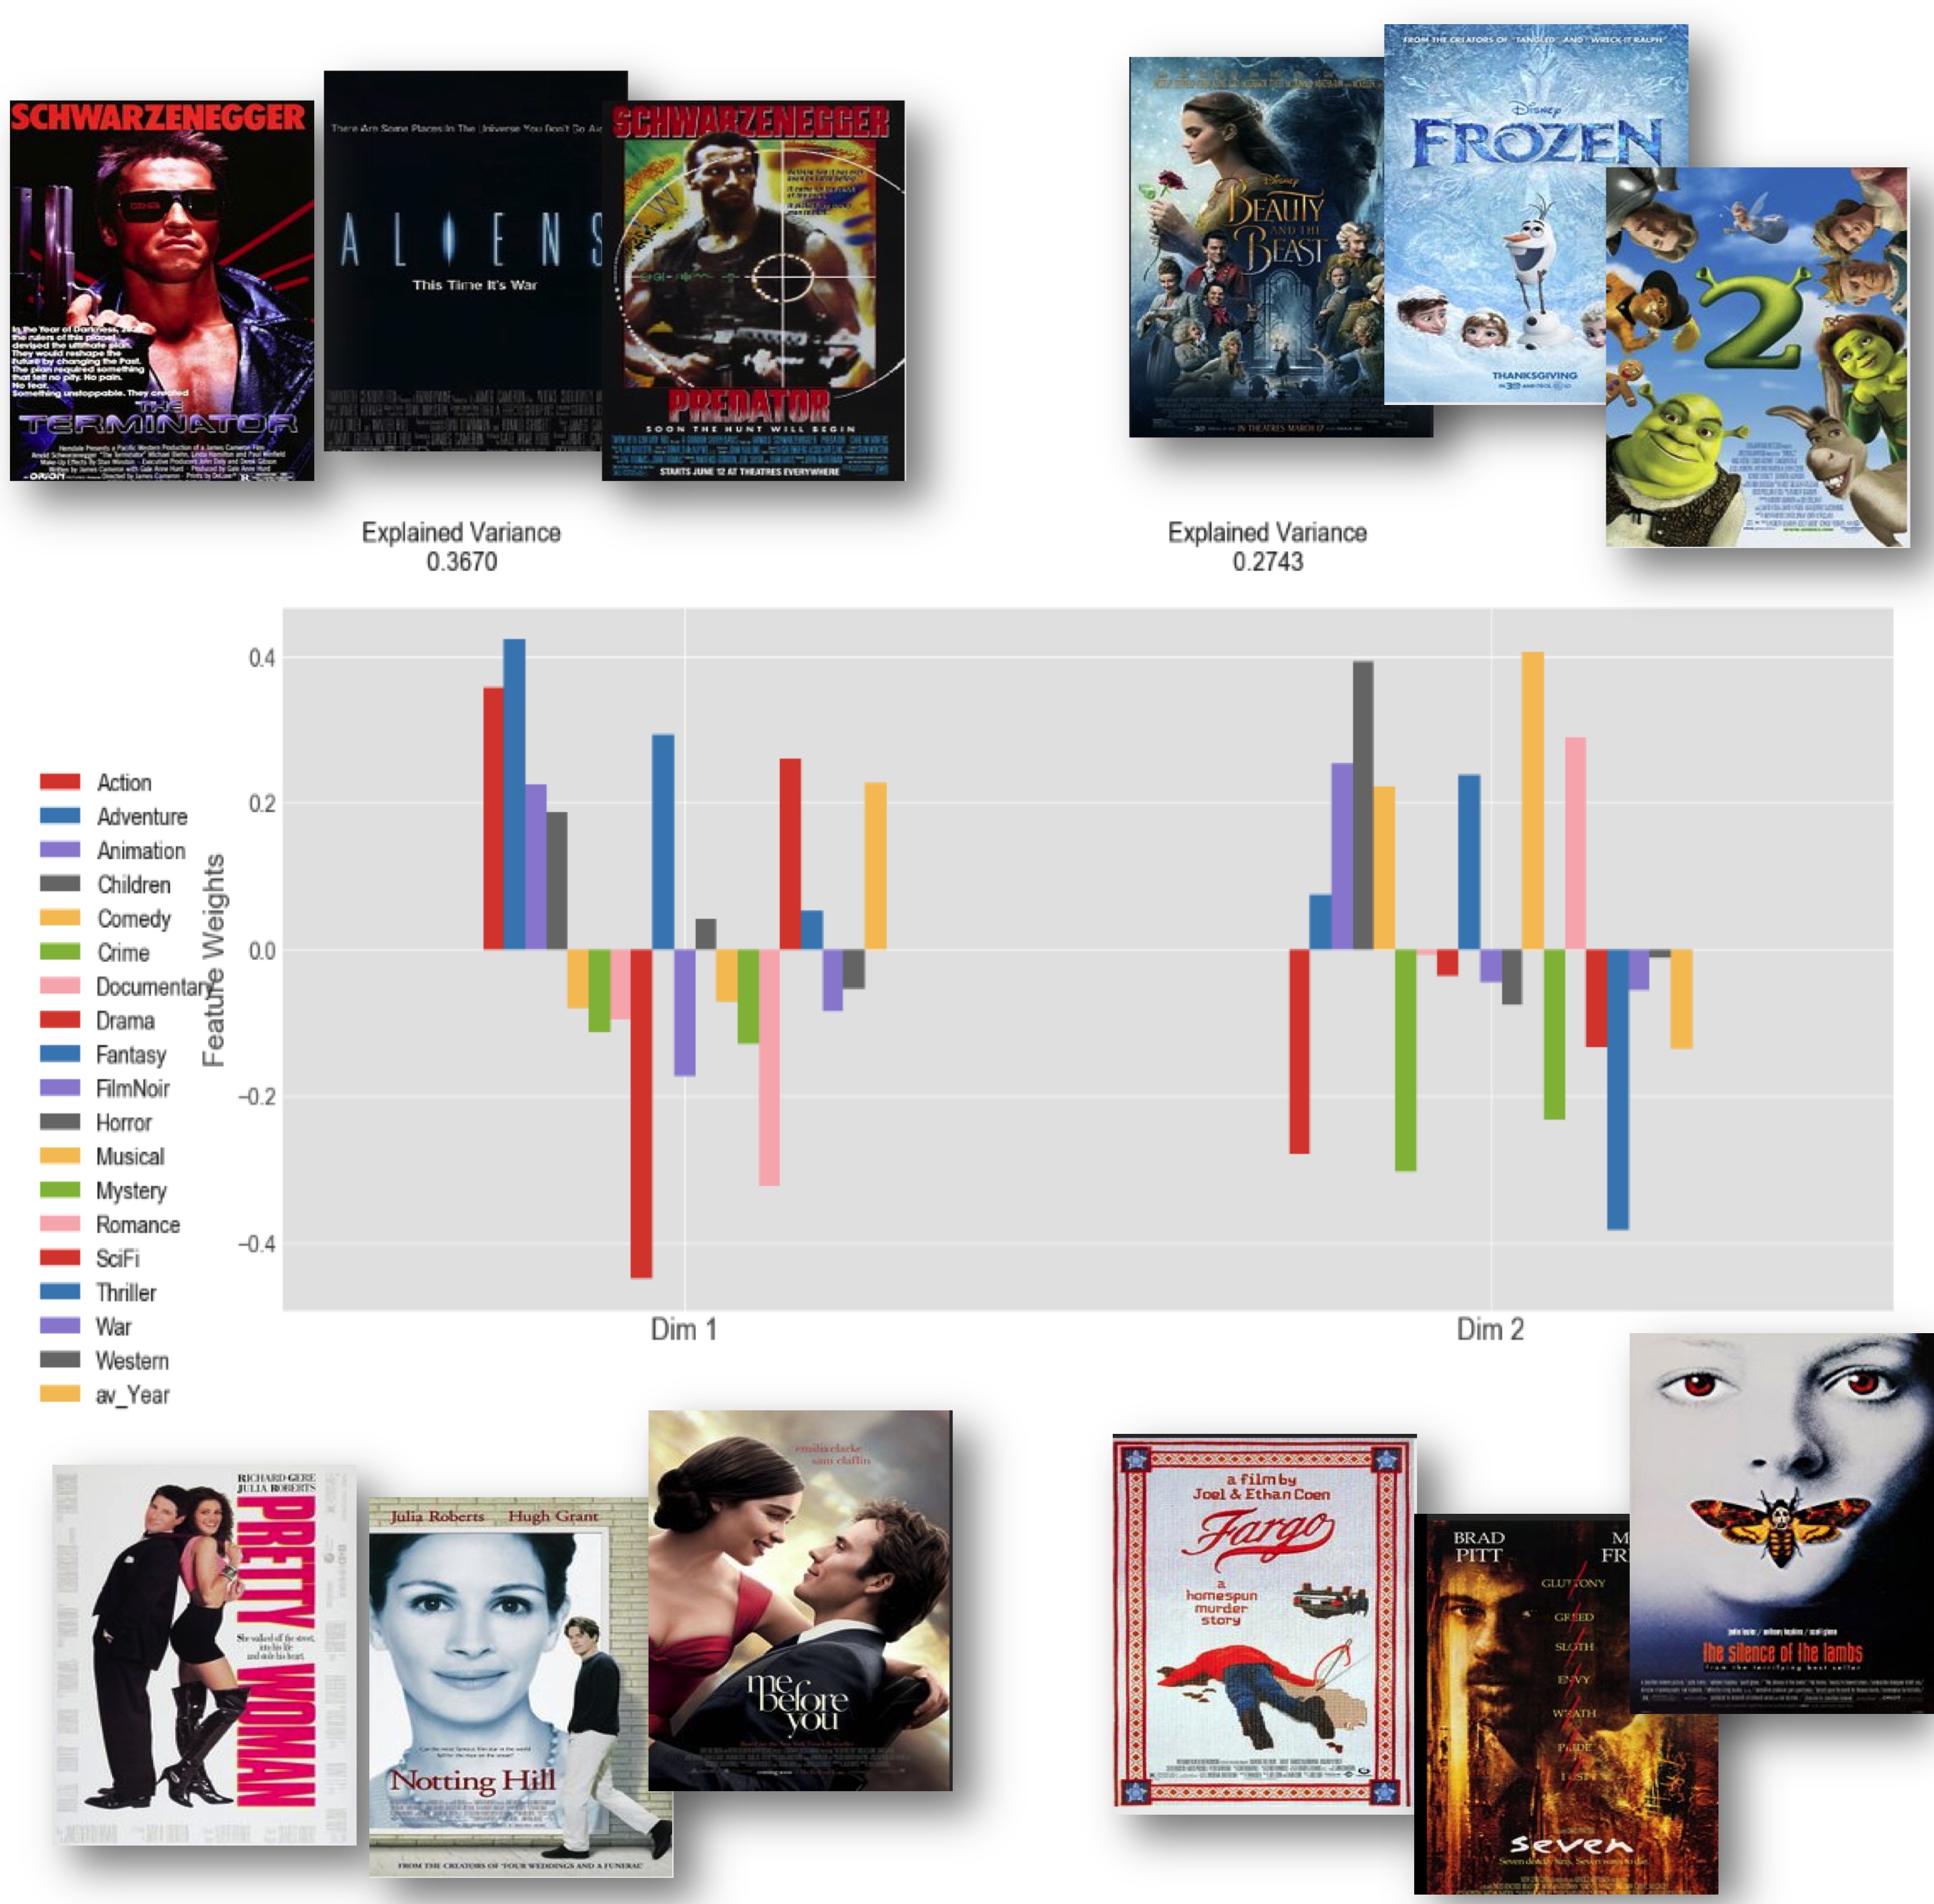
The upper-left of the figure above corresponds to strong weights for Action, Adventure, Fantasy, and SciFi, while the lower-left features the strongest weights for Drama and Romance. This dichotomy represents the most significant single divide in the user movie preferences, and it's surely one of the most obvious broad divides between types of films. The upper-right is dominated by Children, Musical, Animation, and Romance while the lower-right is Thriller, Crime, Action, and Mystery. This second dimension apparently separates light-hearted films aimed at children from more gritty, often violent movies geared towards adults.
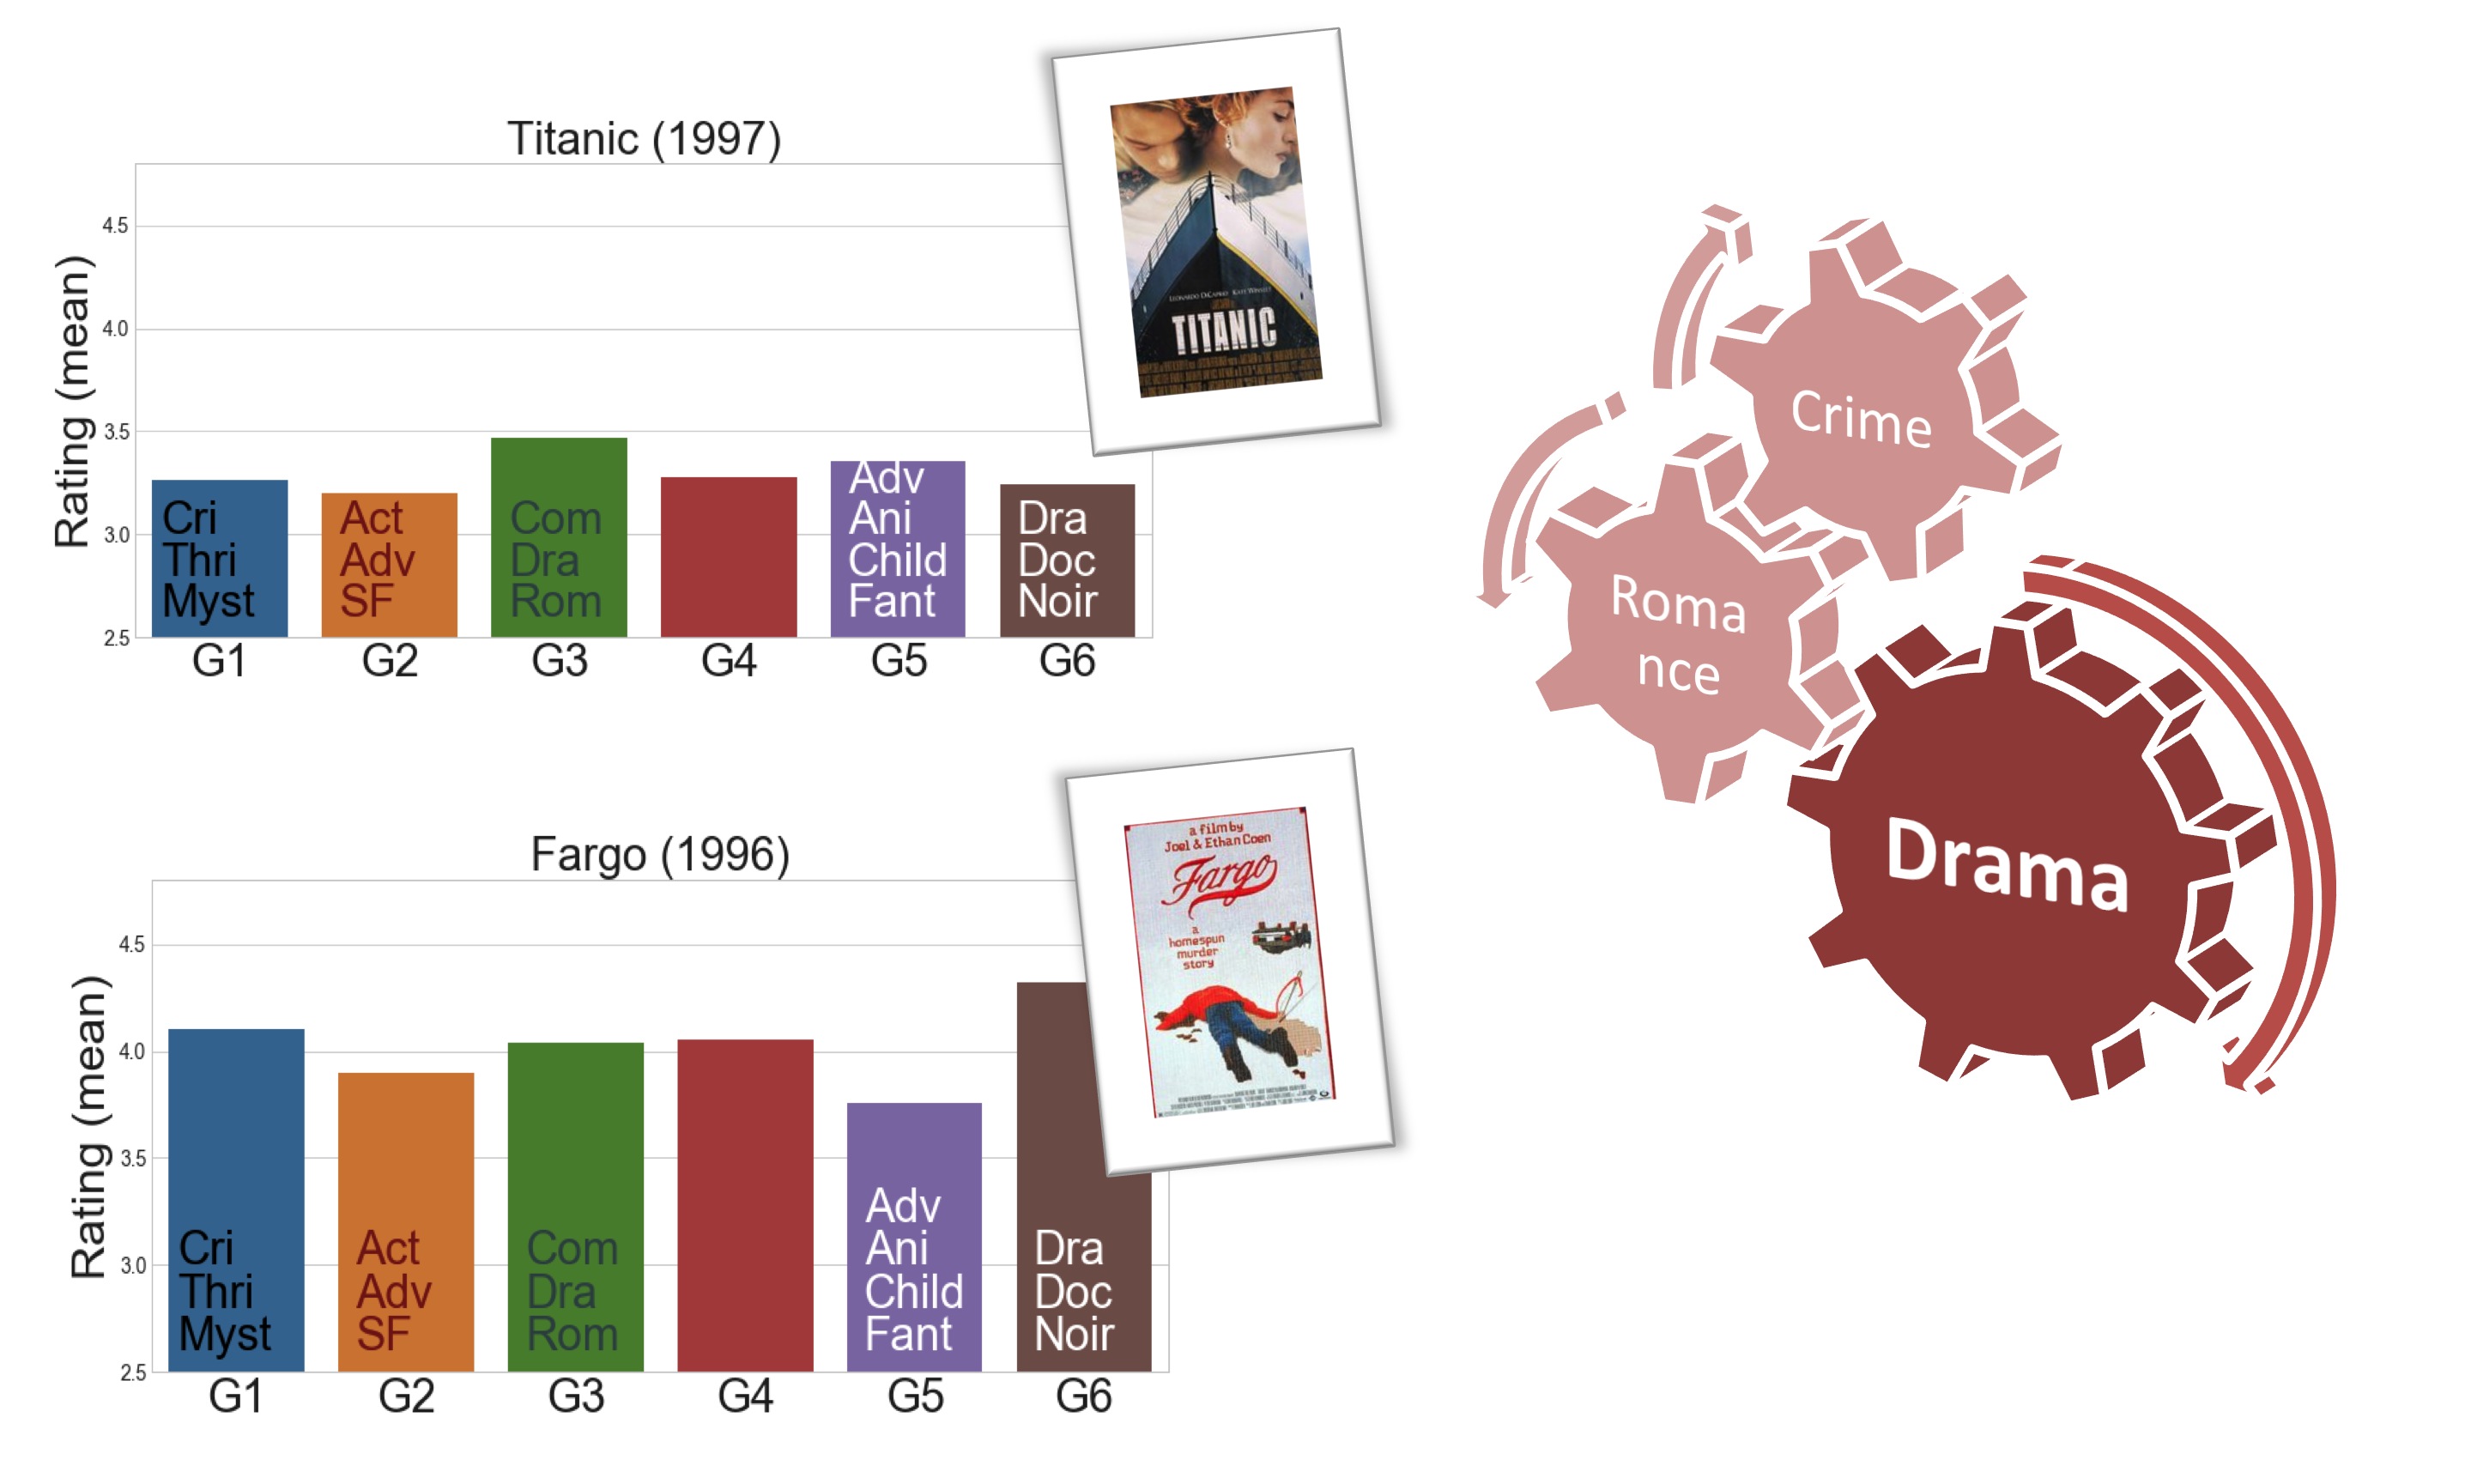
These two dramas above demonstrate the really broad range of films that can be called drama. Titanic is much more of a Romance & Adventure Drama, while Fargo is focused on a Criminal Investigation.
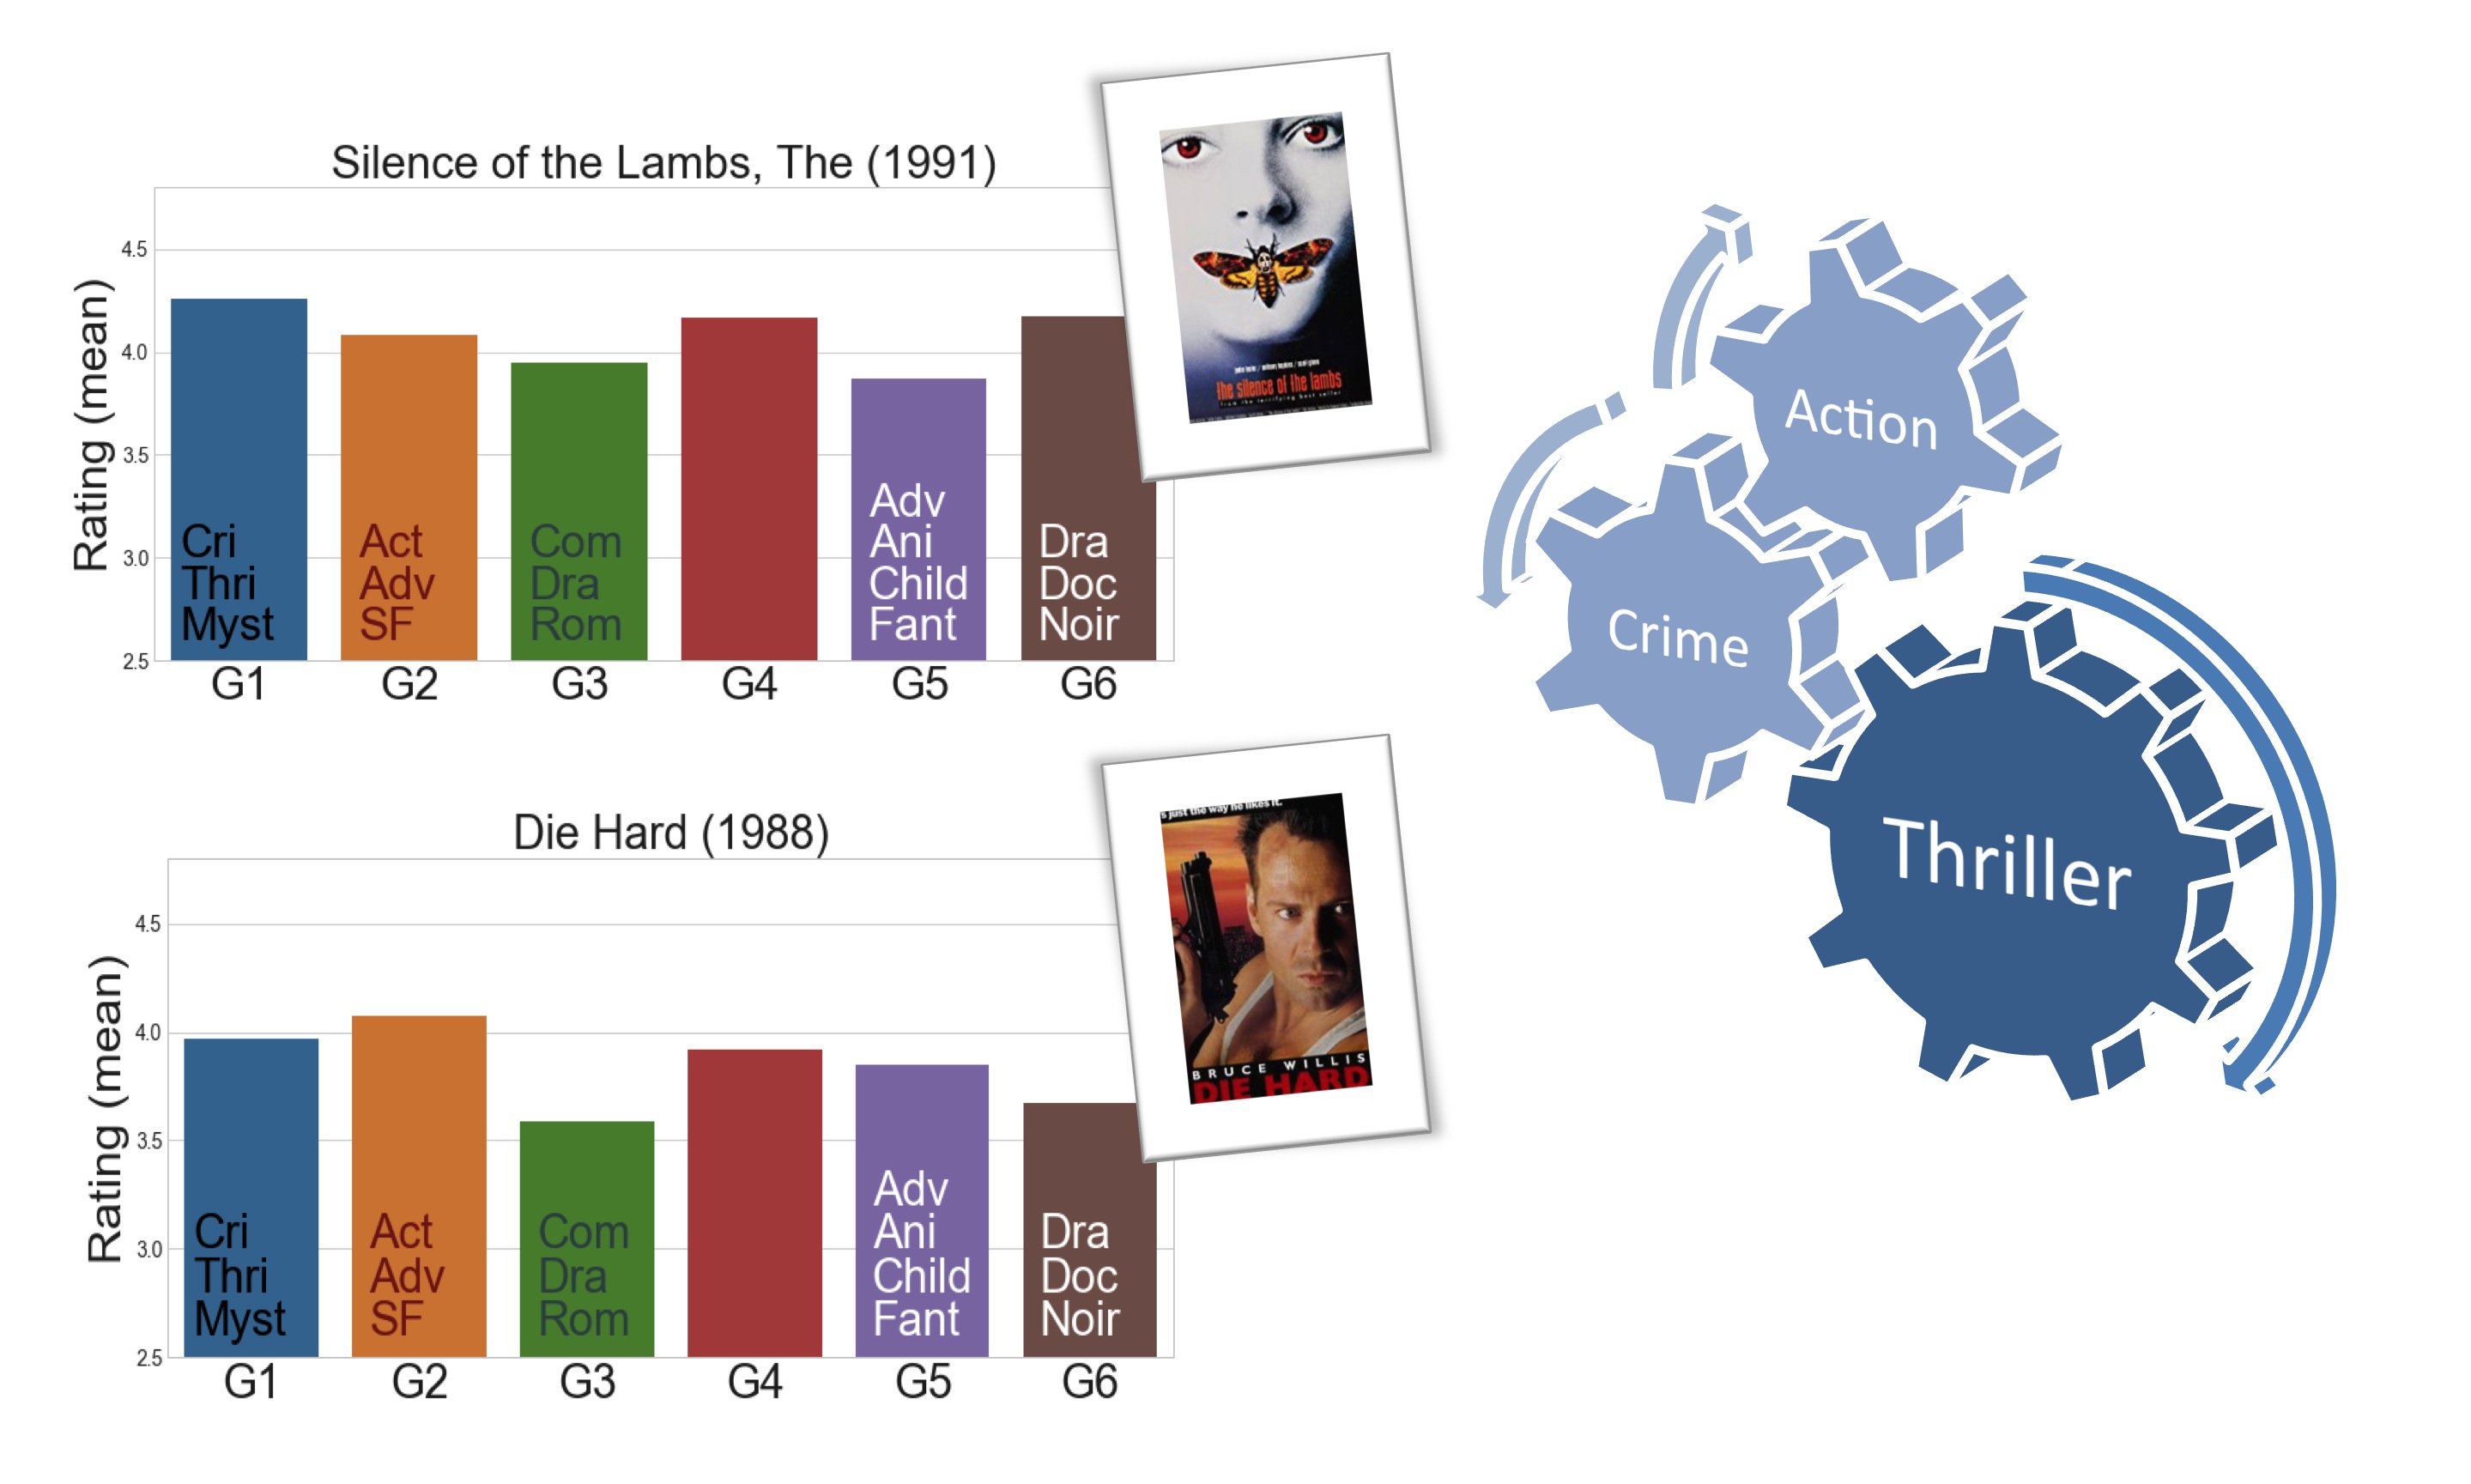
The Silence of the Lambs is a Thriller which has strong Horror and Criminal elements, which is why it is preferred by G1 and G6 in particular. Meanwhile, Die Hard is primarily an Action Thriller that is well-liked by G2.
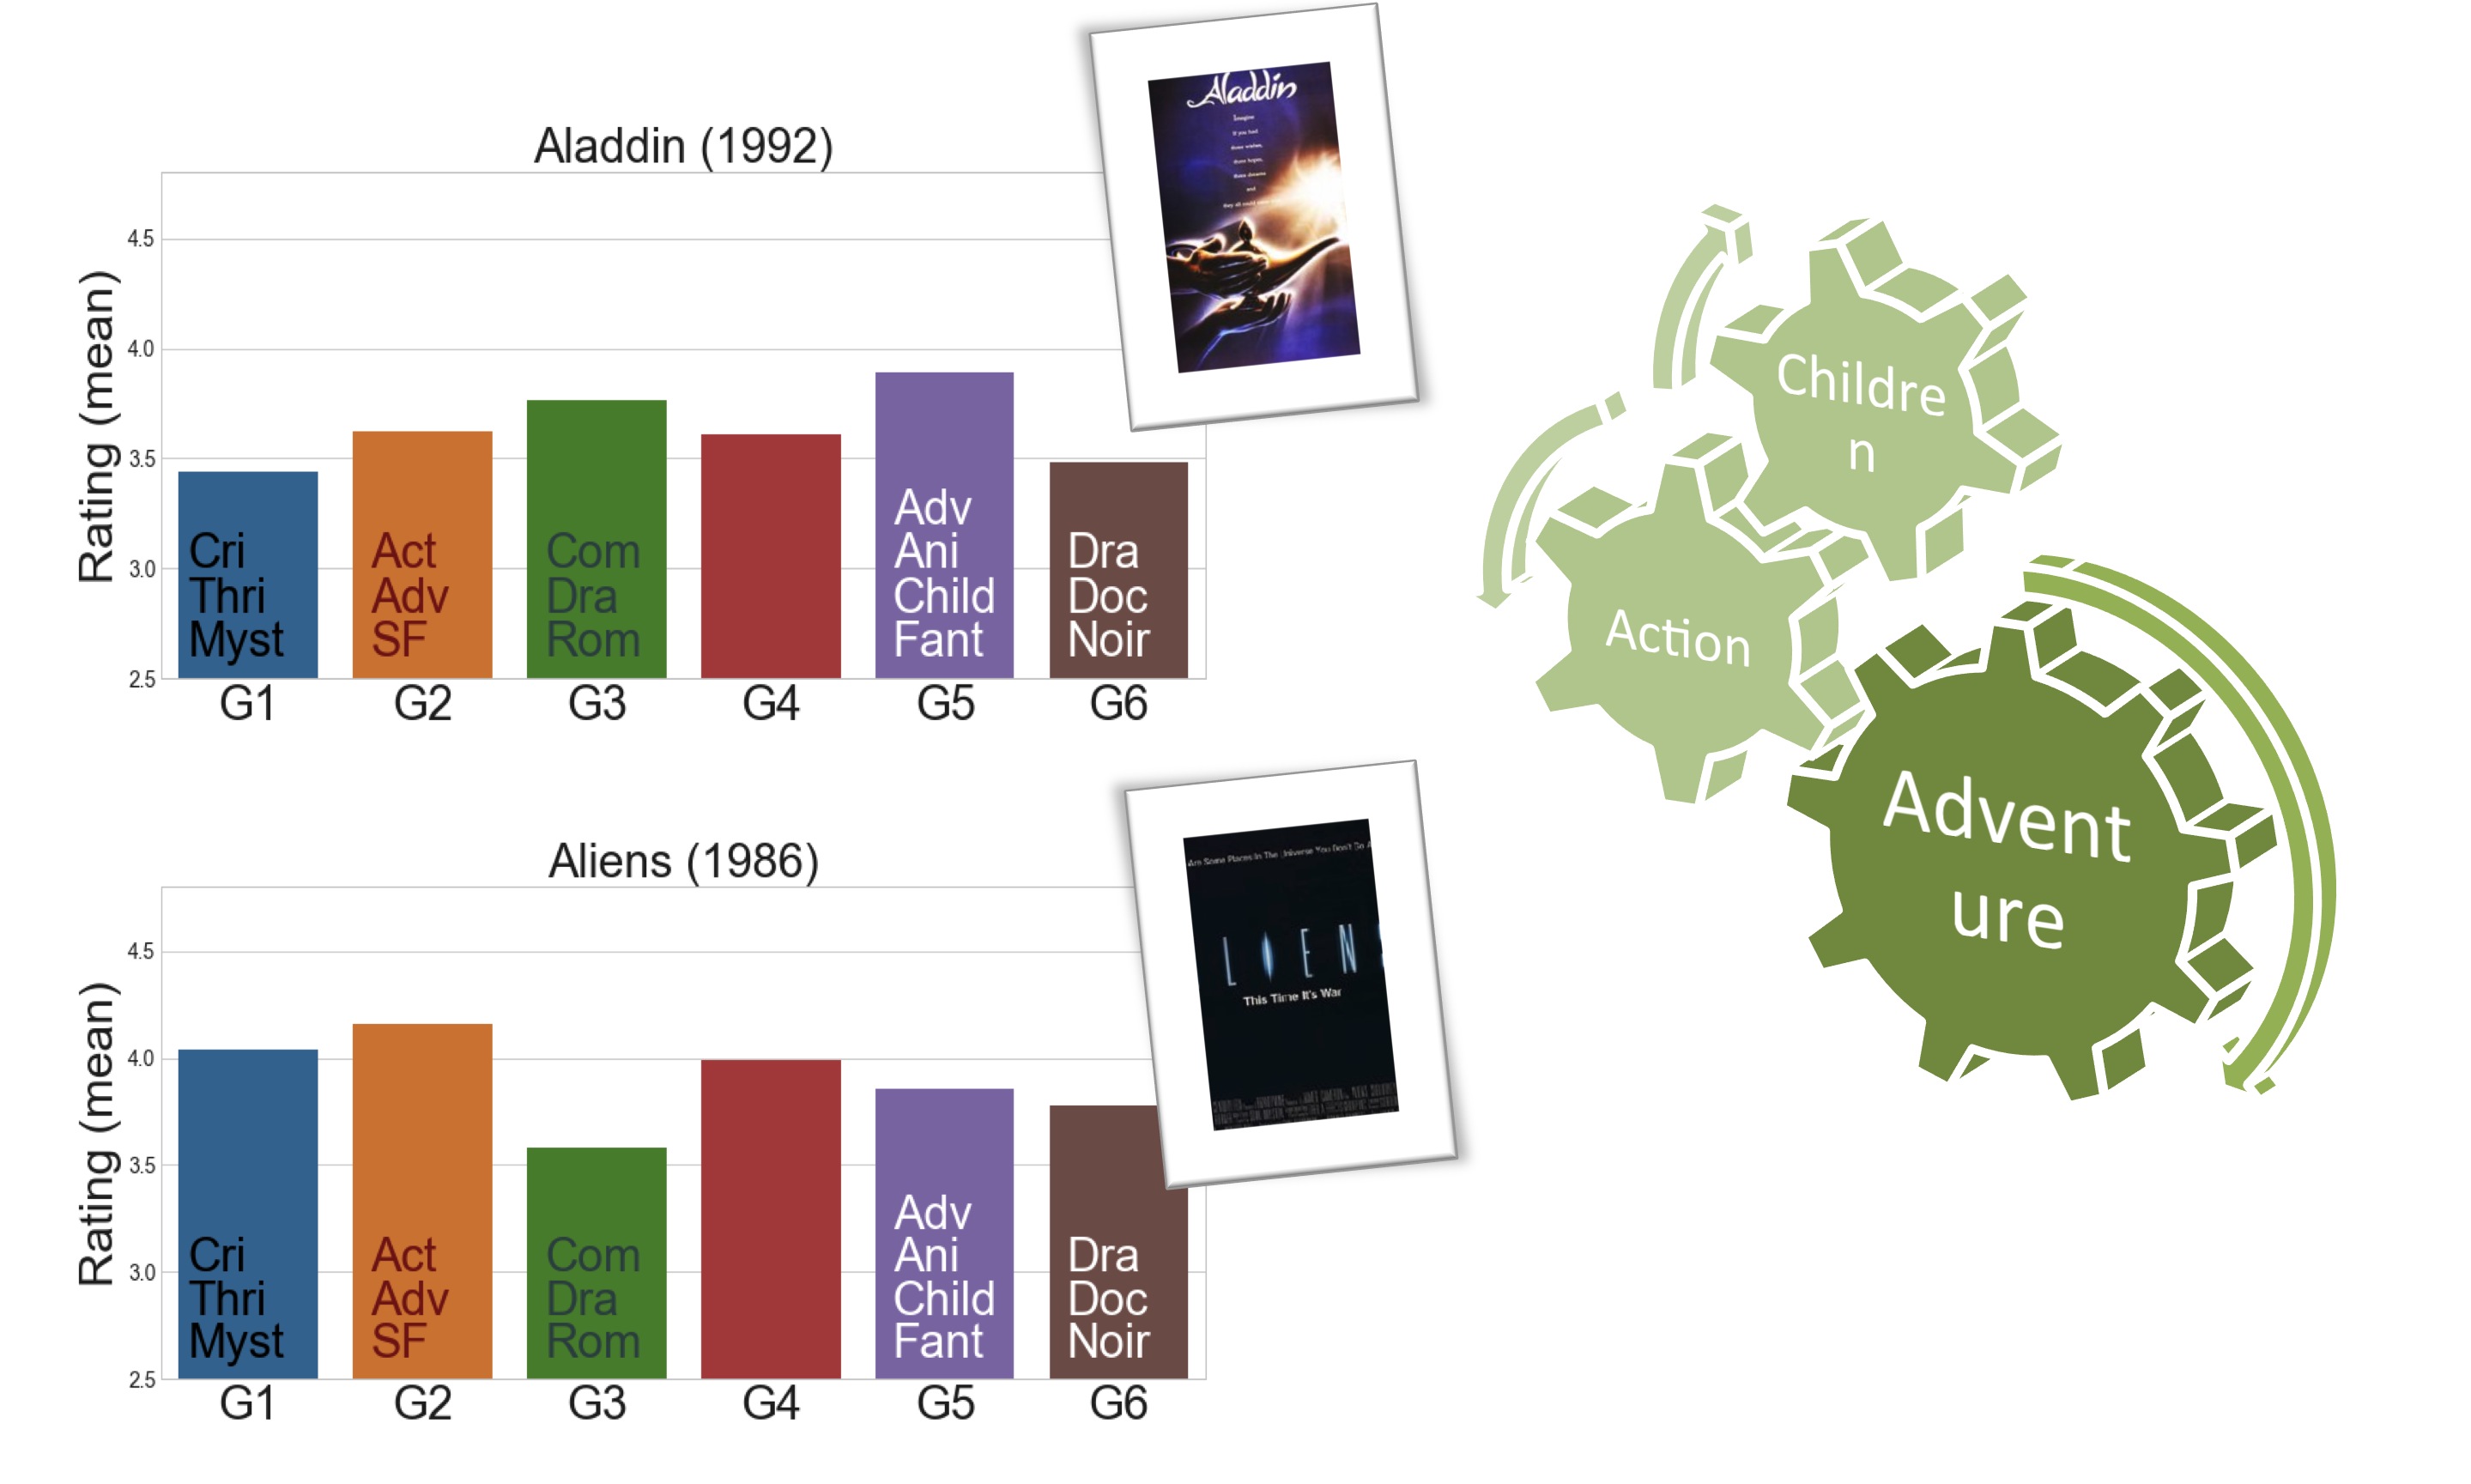
In the Adventure genre, there is a very wide range of films that span from light-hearted movies for Children, like Aladdin, to much darker and Action-packed films like Aliens.
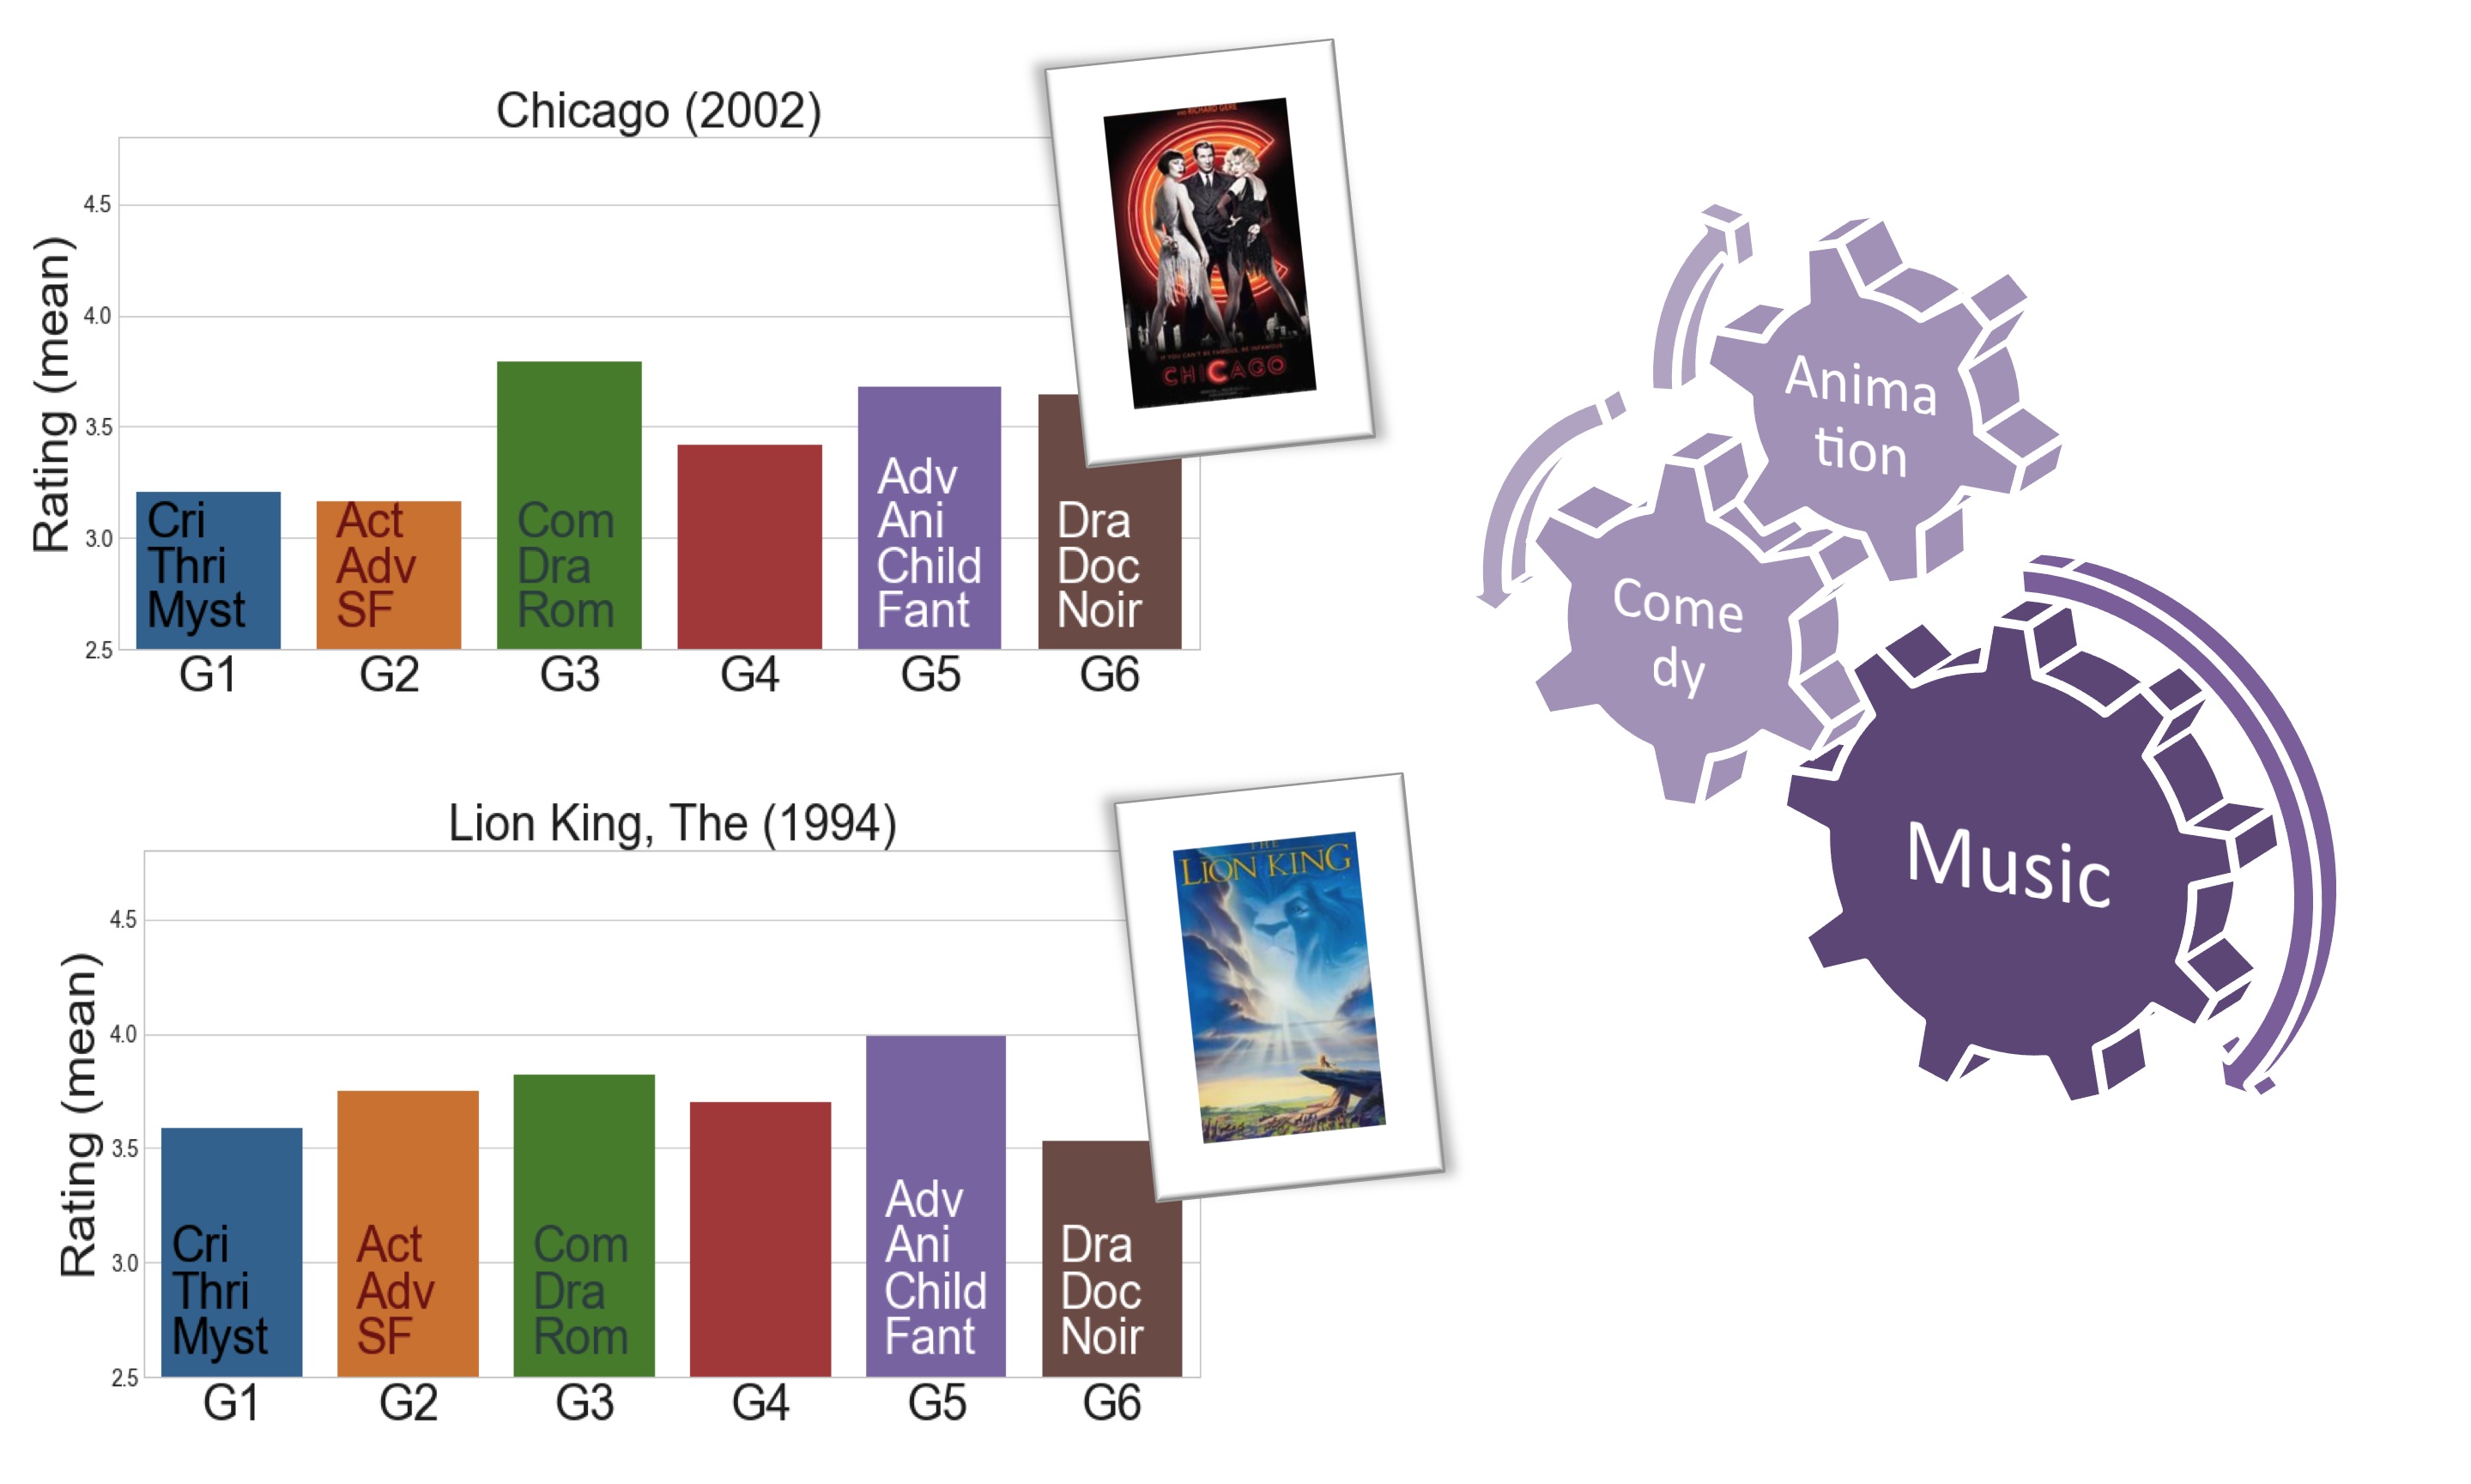
In Musicals, there is likewise a split between the films intended for adults, like Chicago, and those geared towards children, like the Lion King.
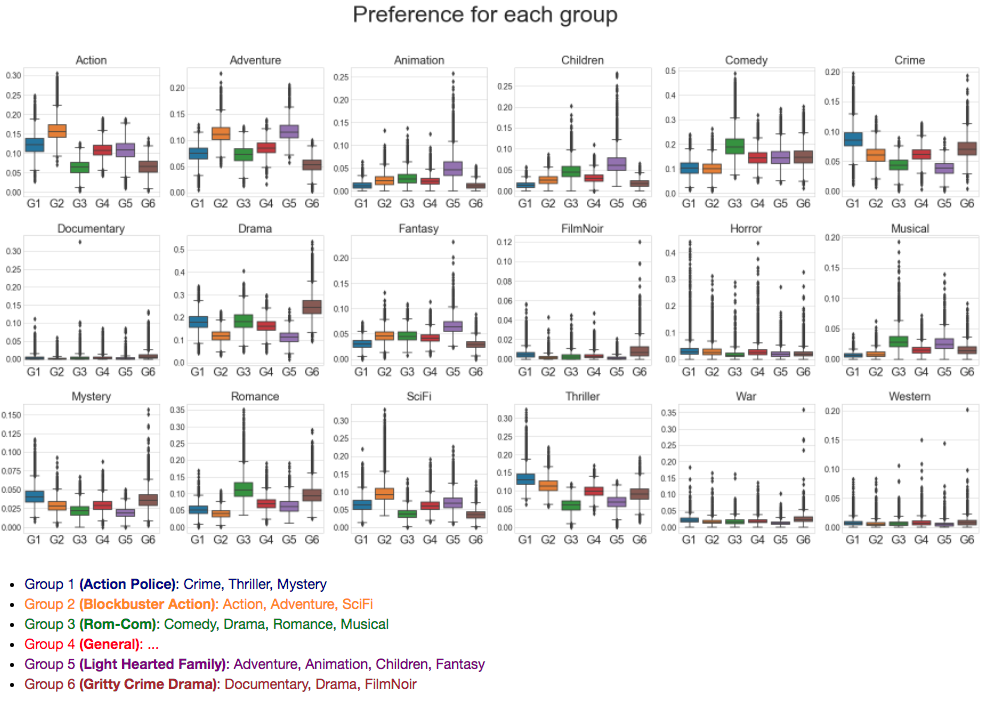
Conclusions
I have examined the ratings that people give to movies, and how those ratings might be biased by people's preferences for certain kinds of movies. It is clear that distinct biases exist based on one's movie preferences. To study these biases more quantitatively, I first used a simple approach that treated each genre independent of each other, but I also clearly found evidence of strong correlations (and anti-correlations) between some genres. So a more rigorous approach was taken to study user preferences which allowed for the inherent correlations between genres to be included by using PCA. The PCA analysis reduced the available features to just two dimensions, corresponding to the two most significant eigenmodes that contribute to the variance in the data. From these two dimensions, I selected six distinct clusters using the unsupervised learning algorithm called KMeans clustering. After checking the different ratings given by users in these six clusters, a pattern emerges that reveals some of the most fundamental divides in movie preferences.